simulations
I recently finished a project on a statistical model of
space.
Below you can click on links to videos that show brief
simulations of the model:
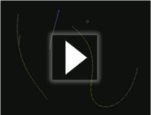
Model with 1d interactions
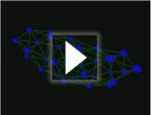
Model with 2d interactions
Idea
The idea is, roughly speaking, to view space as a frozen state of something more general that is described by networks. The basic elements of my model are edges, and the edges are glued together to form networks.
Analogy
A helpful analogy is to think of the edges as atoms. The network corresponds to a particular arrangement of atoms, and space is like the solid that is formed when the atoms arrange themselves in a crystal. The crucial difference to atoms is that there is no space in which the edges move. There is no notion of space in the model except for the network itself. In the videos, the edges are depicted in a 3d space, but this is just a convenient means to visualize the network. This 3d space has no physical meaning.
Purpose
I wanted to specify a model in which the edges interact in such a way that they form a space at low temperature, similarly as atoms bind together to form a crystal when it is cold enough. I am interested in this, since it could give a toy model for understanding space. In a model like this one space is not absolute, but conditional. Space is a special state among other states, and it only occurs under certain circumstances. If we want to understand space, we need to explain it in terms of something else that is not space. In this case, this "something else" are the edges, their interactions and the temperature.
Videos
The first video shows a version of the model, where the interactions are chosen such that the edges form linear chains, i.e. 1-dimensional spaces. In the second video, the rules of interaction are different and lead instead to 2-dimensional networks at low temperature. At the beginning of the simulation all edges are separate from each other. The first 1000 time steps are shown in real-time, i.e. the visualization is updated as the simulation changes the network. Then, from step 1000 to 500000, the graphics pauses, while the simulation runs in the background. At step 500000 the simulation stops and the final state of the network is displayed.
The graphics was generated with Ubigraph, a software for visualizing dynamic graphs. The technical description of the model and the simulations is given in this research paper.